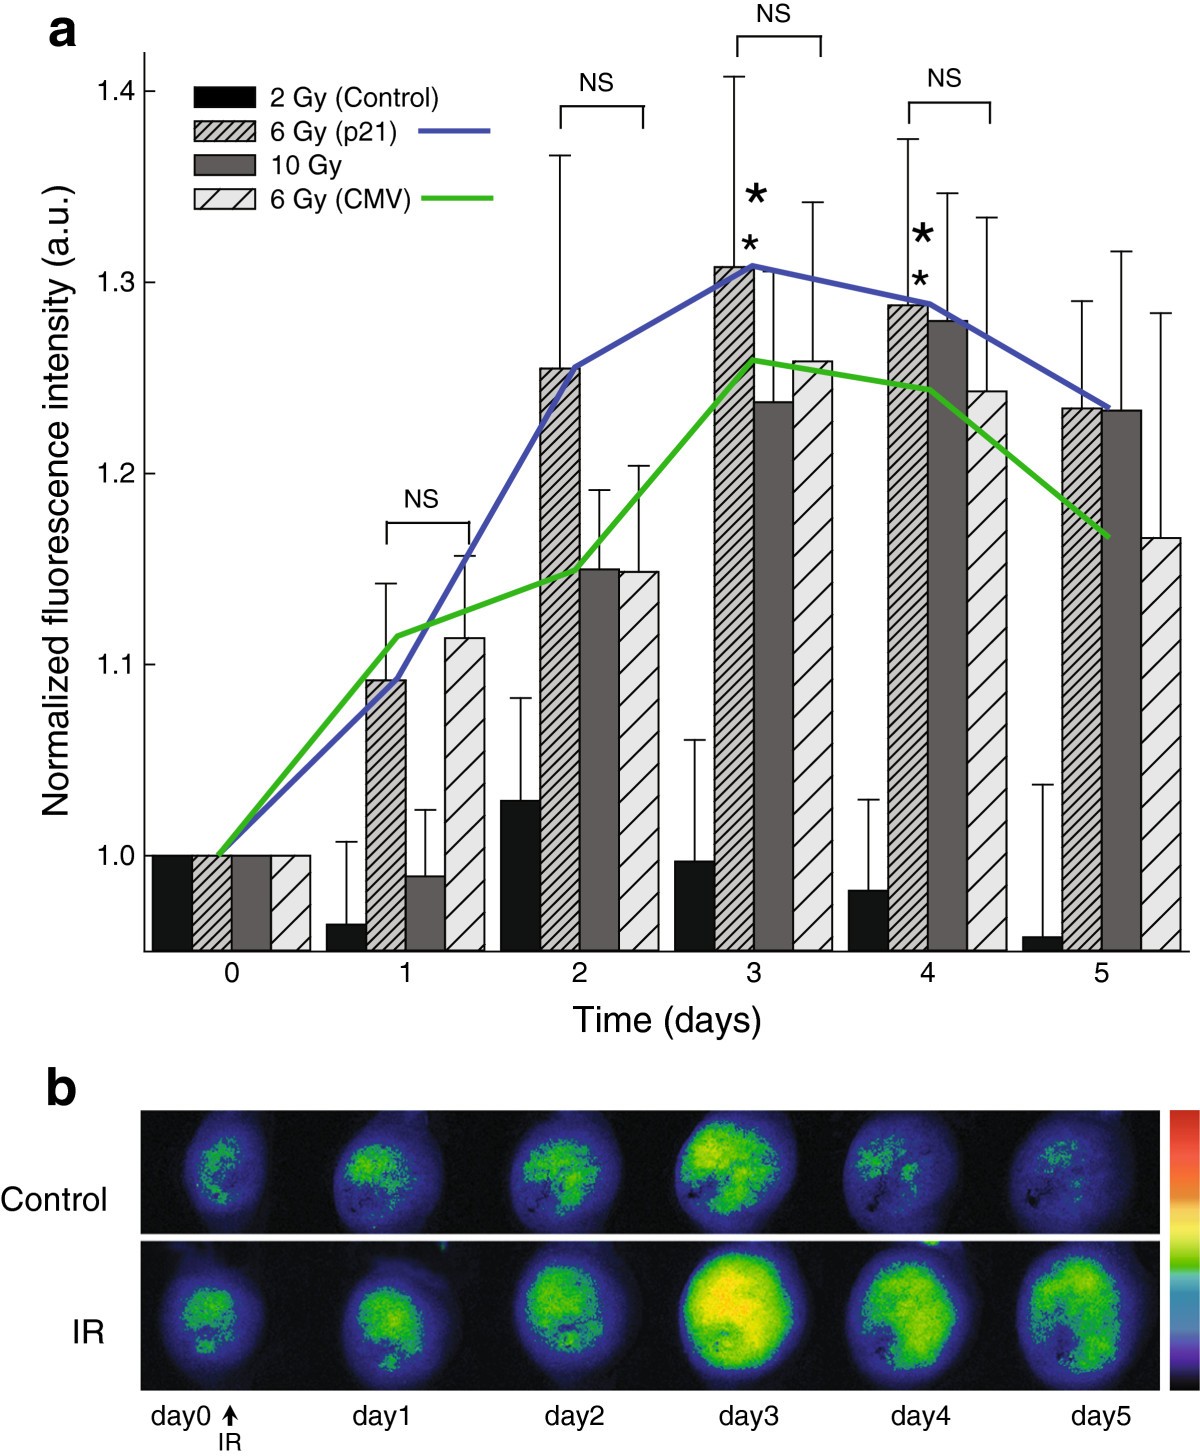
Figure 3

Induction of reporter gene expression in vivo (tumors). (a) Bar chart: normalized fluorescence intensity in the stably transfected TS/A p21-EGFP tumor model with reporter gene GFP under the control of p21 promoter after 0, 2, 6 and 10 Gy irradiation, and in TS/A CMV-EGFP tumor model with reporter gene under the control of CMV promoter after 6 Gy irradiation. For all experimental groups fluorescence is expressed in arbitrary units and is normalized on the day 0 and on the appropriate controls: for the p21 promoter on the non-irradiated TS/A p21-EGFP tumors and for the CMV on the non-irradiated TS/A CMV-EGFP tumors. The data were pooled from 2 independent experiments with 4–5 animals in each experimental group and are presented as means + SEM; *, P < 0.05 vs. control; NS, non-significant. Line plot: comparison of the induction dynamics of the inducible p21 and constitutive CMV promoter after 6 Gy irradiation. (b) Images of stably transfected TS/A p21-EGFP tumors in control group and experimental group that received 6 Gy irradiation (IR). Fluorescence intensities are represented linearly on a rainbow scale with red being the maximum signal and black being the lowest signal.
