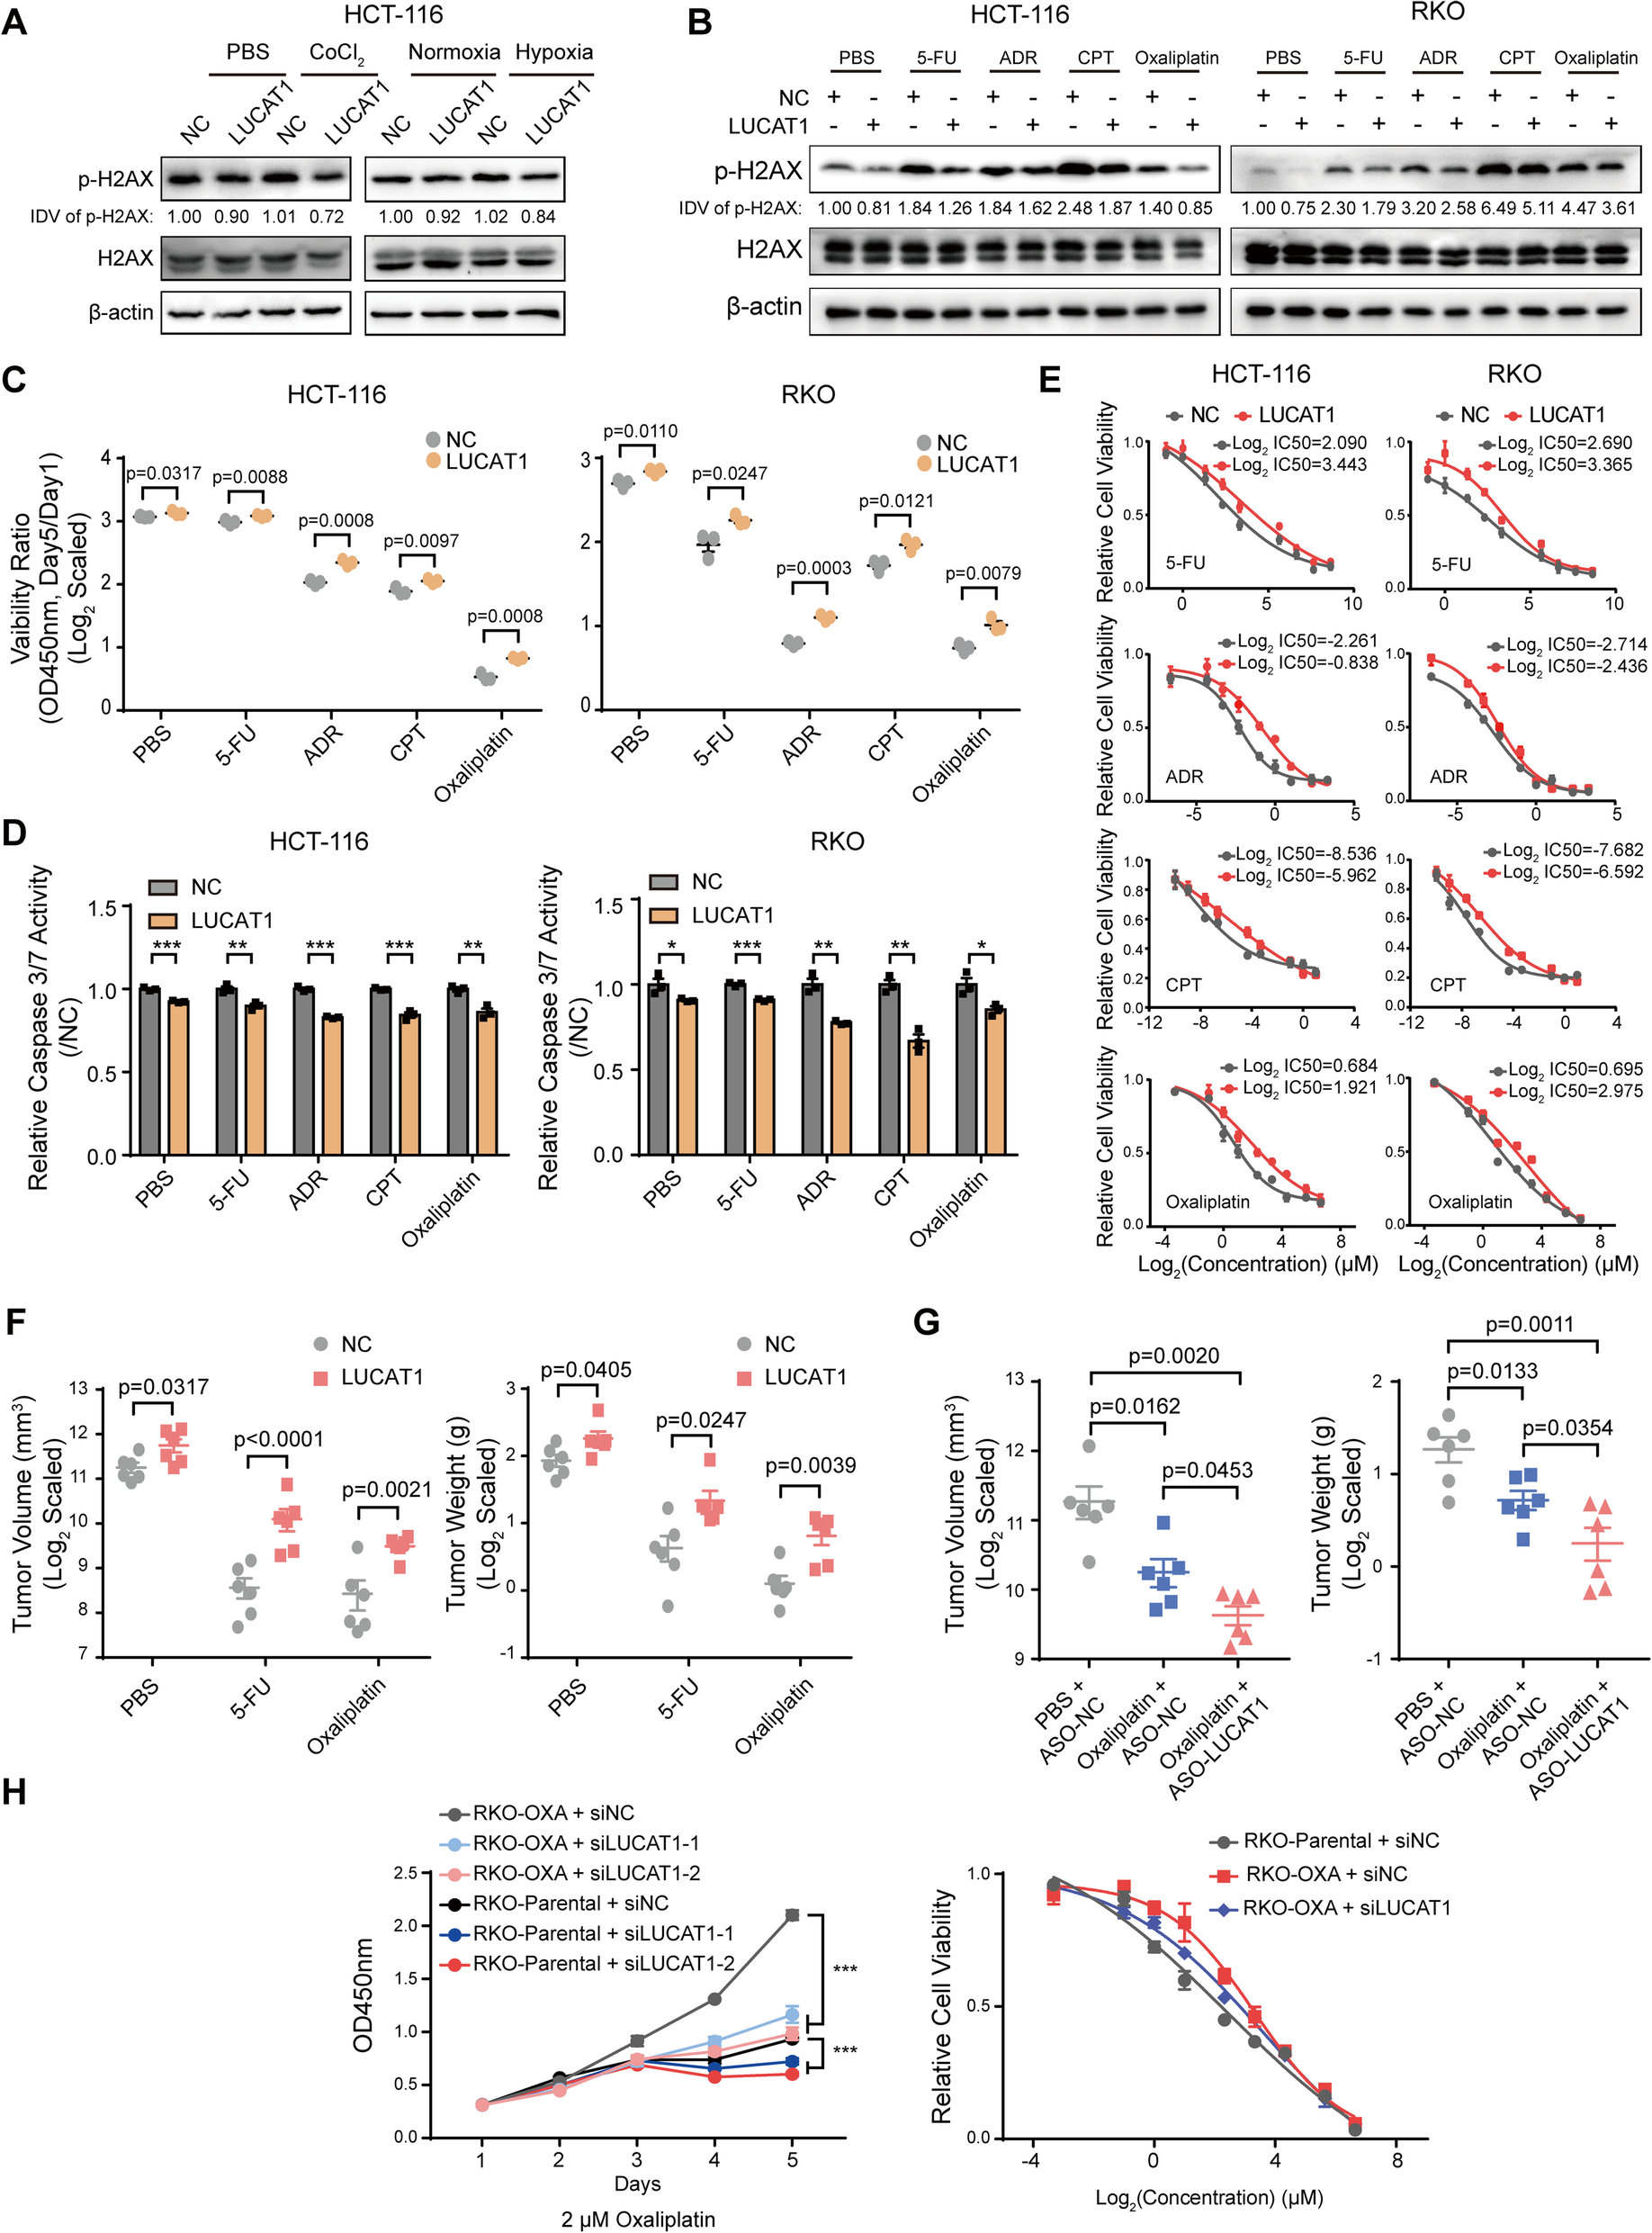
Fig. 6
From: Hypoxia induced LUCAT1/PTBP1 axis modulates cancer cell viability and chemotherapy response

High LUCAT1 confers CRC cells to chemotherapy resistance. a Western blotting for p-H2AX in NC or LUCAT1 overexpressing HCT-116 cells following indicated treatment. Integrated Density Value (IDV) was obtained by ImageJ and normalized by the first lane. b Western blotting for p-H2AX in NC or LUCAT1 overexpressing CRC cells treated with various drugs. Integrated Density Value (IDV) was obtained by ImageJ and normalized by the first lane. c CCK8 assays of CRC cells treated with various drugs. Viability ratio was represented with the OD450nm ratio by day 5 to day 1. n = 3 independent experiments, two-tailed Student’s t-test. d Caspase 3/7 assays were conducted in NC or LUCAT1 overexpressing CRC cells treated with various drugs. n = 3 independent experiments, two-tailed Student’s t-test. e Viability of NC or LUCAT1 overexpressing CRC cells treated with serial indicated doses of chemotherapeutic drugs. n = 3 independent experiments. f In vivo analysis of tumor volumes and weights in mice harboring NC or LUCAT1 overexpressing HCT-116 cells treated with PBS, 5-FU and Oxaliplatin. n = 6 tumors, two-tailed Student’s t-test. g In vivo analysis of tumor volumes and weights in mice with indicated treatment. n = 6 tumors, two-tailed Student’s t-test. h CCK8 assay and viability assay of RKO-parental and RKO-OXA cells transfected with siNC or LUCAT1 siRNAs, treated with 2 μM Oxaliplatin and treated with serial indicated doses of Oxaliplatin. n = 3 independent experiments, two-tailed Student’s t-test. * p < 0.05, ** p < 0.01, and *** p < 0.001
